Cross Platform Proteomics and Transcriptomics Data Integration for Full Spectrum Cancer Profiling
This work is presented on 2023 QBI (Quantitative BioImaging) Workshop on Multiplex Image Analysis
Multiomics is a new technique that has been increasingly used in cancer research. There are many platforms available, and each has its unique strength on profiling cancer tissue. For example, CellDive can quantify more than 40 protein markers, while NanoString CosMx can quantify expression level for more than 1000 mRNAs. However, the analytical methods based on multiomics data are still suboptimal. In this QBI workshop, we presented our work on combining information from different platforms, so that we can validate our results using data from different platform, and provide full spectrum cancer profiling to facilitate the development of cancer treatment.
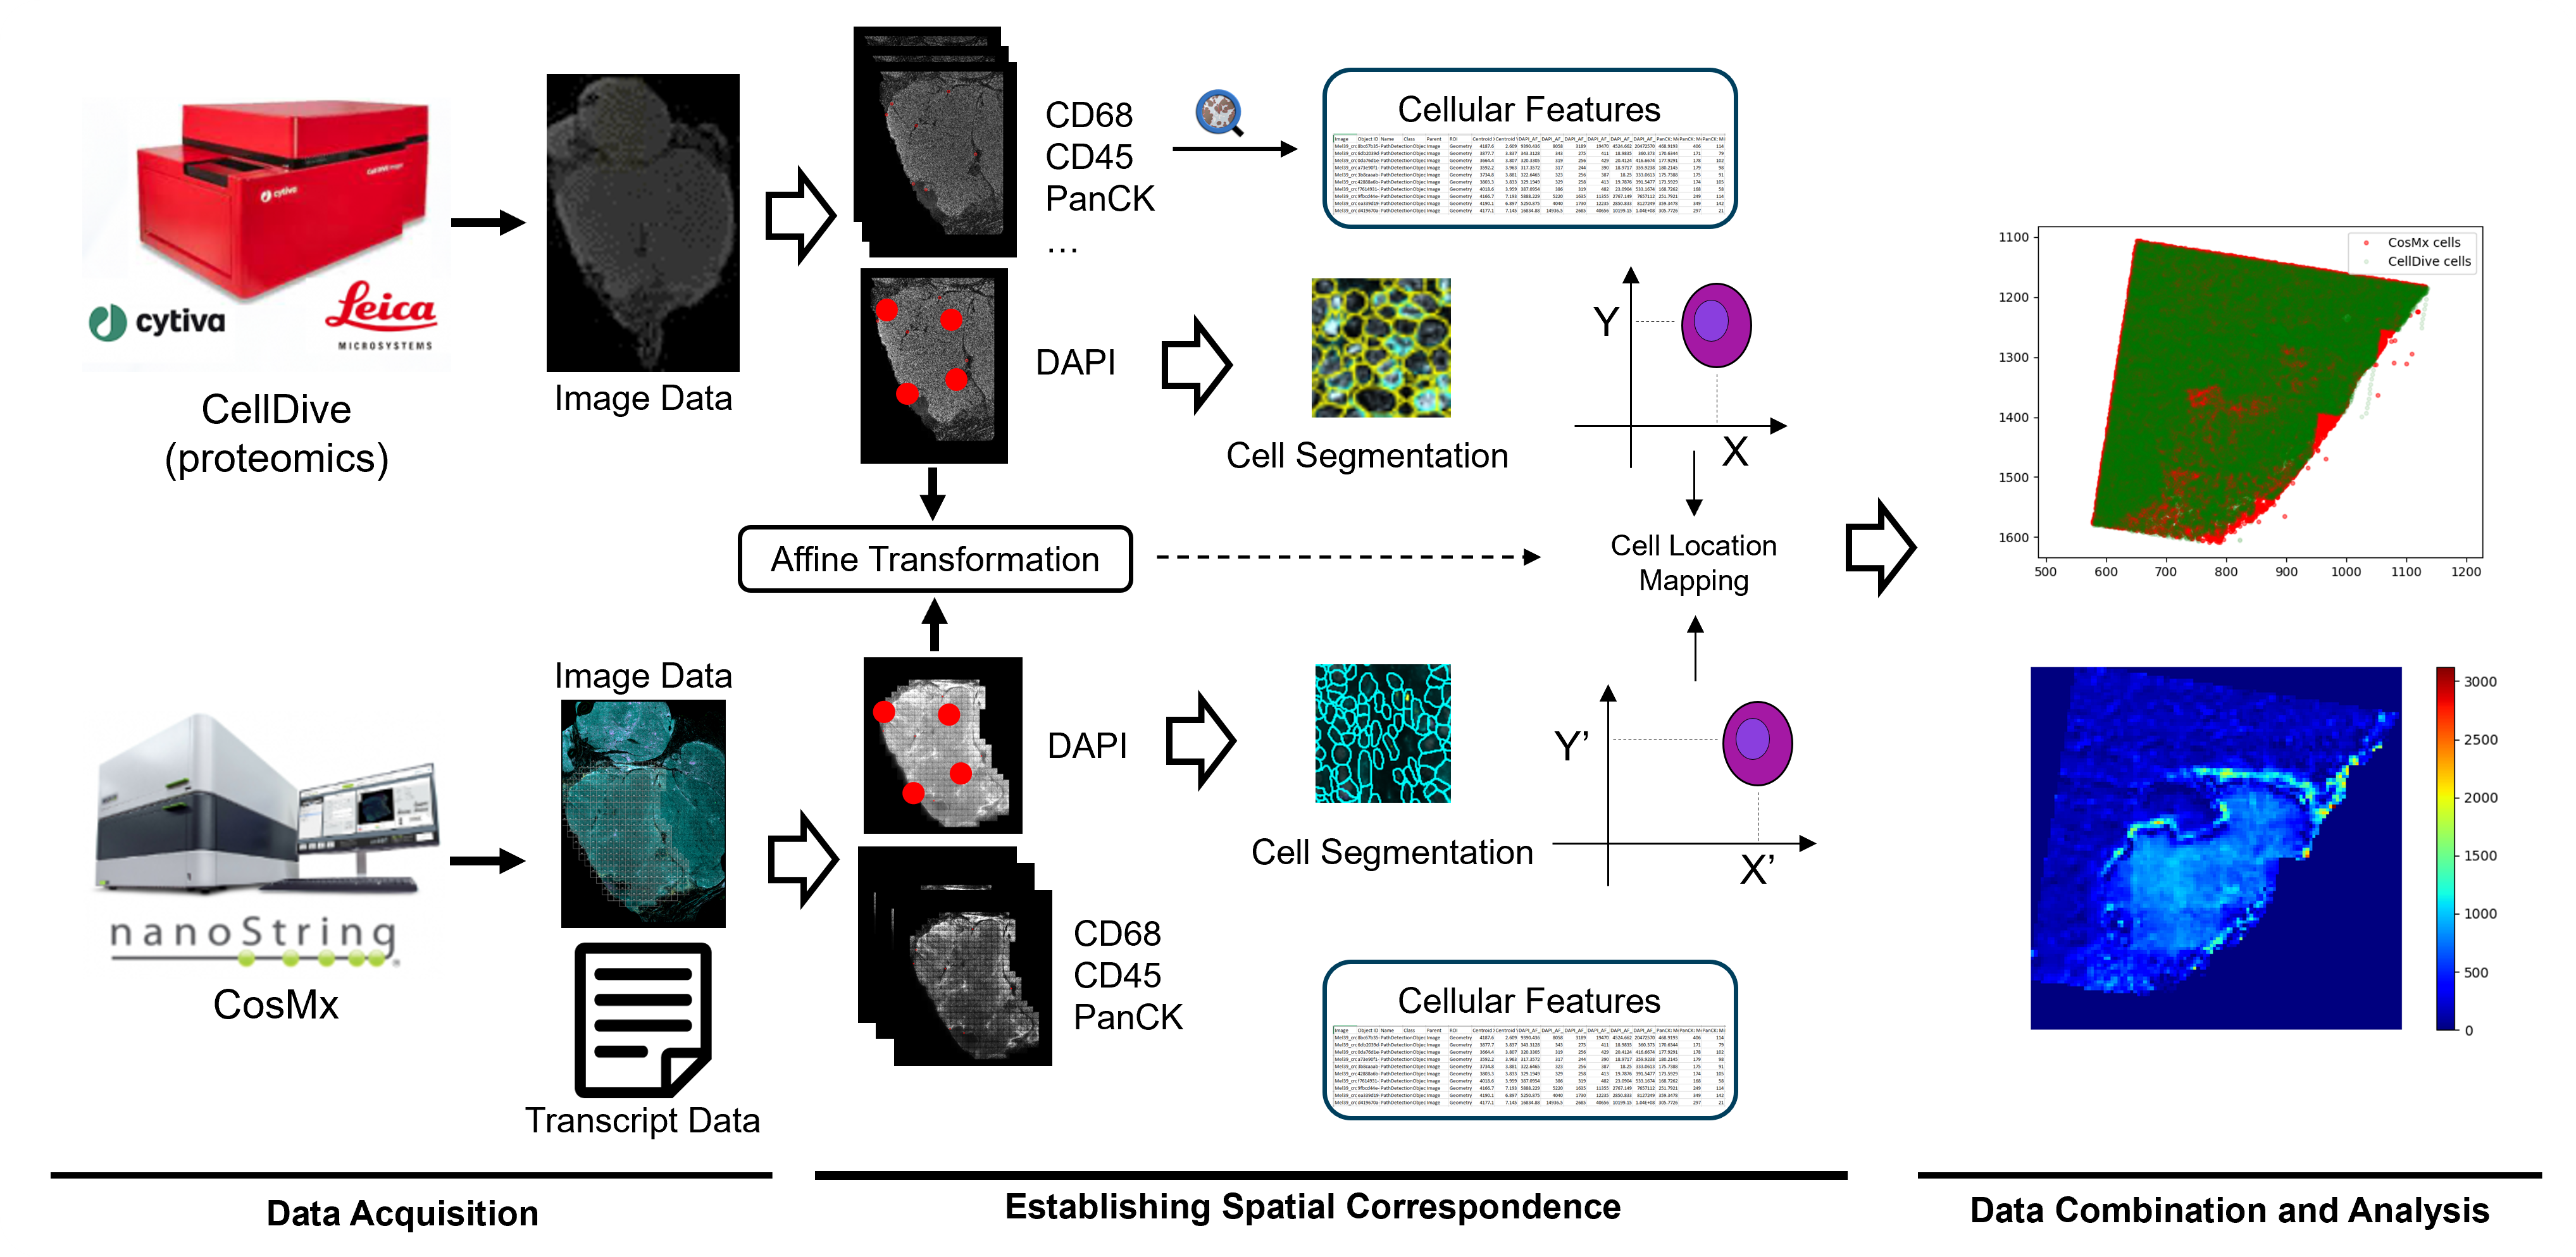
We used data from two platforms. One is CellDive, the other one is CosMx. Both platforms provide multiplex image data. The differences are that the CellDive provides much more protein marks, while the CosMx provides extra transcript data, which is not available in CellDive. That’s why we would like to combine the data and leverage the advantages of each platform. To combine the data from the two platforms, we used DAPI images as the reference to establish the spatial correspondence between the two platform. The DAPI images were aligned based on manually annotated landmarks. This image registration step gave an affine transformation to match the coordinate systems within the two platforms. Then, we used DAPI and PanCK channels for cell segmentation in CellDive, and then used QuPath to get the quantification of cells. Based on the affine transformation we get from DAPI alignment, we can map the cells from the two platforms into a shared coordinate system. This is how we made combinational data analysis happens.
We get some preliminary results from current dataset: First, it is encouraging to find structural level alignment is valid. To achieve higher alignment accuracy for cell neighborhood analysis, we may have to acquire better dataset. Second, we find that in structural level, protein marker signals are generally comparable, especially in immune cell prolific regions. And in these regions, immune related gene expressions are also high, but not necessarily low in the rest regions.
Currently, we are generating new dataset to fill the gaps in our previous experiments, and also trying to scale up to have more significant results.
Workflow of this study